
In India, food grains are one of the most essential commodities for low-income households. In order to properly store and distribute grains, the government of India set up what are known as Public Distribution Systems (PDS) in 1960.
As a result, India has the world's largest food distribution network, serving over 800 million people. The last stage in this network are the fair price shops, which are government-run outlets. There are over 500,000 of these shops across the country where commodities are sold at subsidized prices.
In 2020, COVID-19 lockdowns severely impacted the PDS by restricting the movement of people and the transportation of goods, resulting in food scarcity.
The National Institute of Industrial Engineering (NITIE), now the Indian Institute of Management Mumbai (IIM Mumbai), conducted research into the impact of COVID-19 to manage supply chain disruptions that could affect the PDS.
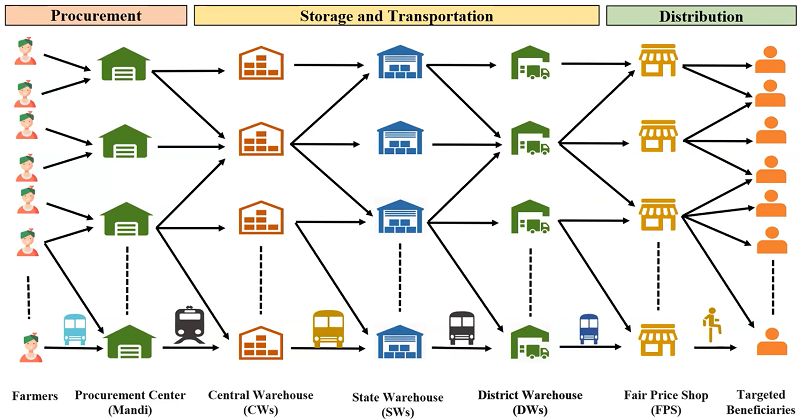
The food grain supply network of India is illustrated below, and during COVID-19, there were interruptions to this at every stage.

Food grain supply network of India
A system like this will always face immense challenges, but COVID-19 exacerbated the existing ones and brought new ones. These additional challenges included:
In order to create the simulated Public Distribution System network and understand how to manage the supply chain disruptions from COVID-19, researchers at NITIE decided to focus on the Maharashtra PDS. Maharashtra is a state of India that is divided into six regions, then into districts, and so on until the final step of the fair price shops. Approximately 69 million people benefit from the government initiative in this state alone.
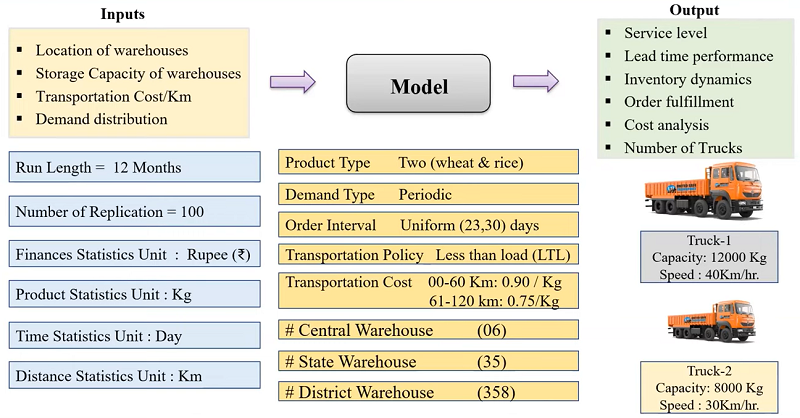
To develop the simulated network, the NITIE team needed to identify the necessary inputs, outputs, and parameters. These are illustrated below.

The inputs, outputs, and parameters necessary for the simulated PDS network
After this, different scenarios were created that would need to be analyzed:
The different scenarios implemented in the PDS network (click to enlarge)
Three risk mitigation strategies were identified in scenario 4 that could help overcome the pandemic restrictions and help manage supply chain disruptions. The first was redundancy, which involved a 20% increase in warehouse capacity and a 20% increase in cycle and safety stock. The second was responsiveness, and this enabled a 20% increase in the speed of trucks involved in the network. The third and final strategy was flexibility, which enabled more understanding and the ability to move goods between warehouses depending on supply and demand.
The results of this simulation can be seen directly by using various graphs. Looking below, three of the supply performance factors from the simulated supply chain can be seen in the results – average daily inventory, service level, and vehicles used. These outputs from the simulation provide a clear view of the impact of different scenarios. Scenario 0 is the base line.
In the pandemic scenario, the average daily inventory was increasing, but this was hard to maintain because of the supply reduction caused by some of the challenges identified previously. Upon applying risk mitigation, the inventory decreased, and then this level was maintained for each warehouse.
Similarly, for the service level by product, when the pandemic started, the level of both rice and wheat decreased, then gradually increased after reaching a low point in the middle of the lockdown. But by again applying risk mitigation, the service level was improved by 5-6%.
Looking at the last factor, the average number of vehicles used increased during the pandemic, but after applying risk mitigation once again, this number dropped to a more acceptable and manageable amount.
Experimental results and analysis of three supply performance factors (click to enlarge)
So, as we can see, by using anyLogistix, NITIE was able to investigate risk mitigation strategies to manage food supply chain disruptions during a pandemic and adjust operational and tactical decisions. Using four possible scenarios, they also analyzed and quantified the food supply chain’s performance. Finally, they understood the optimal shipment quantity of food grain and the ideal number of vehicles required for shipping between warehouses.
In the future, NITIE would like to take their analysis further by creating a digital twin or exploring other solution approaches, e.g., machine learning techniques. They are also considering implementing mathematical modeling as well as a multi-objective optimization of the food grain supply chain network.
This case study was presented by Ramesh Kumar, NITIE, at the anyLogistix Conference 2023.
